Accuracy Statistics
Striking analysis tools
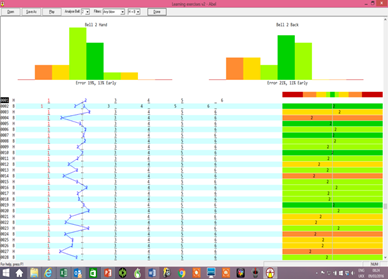
All of the simulation software tools produce a graphic representation of a ringer's or band's striking to help identify any consistent problems. The latest releases even allow you to record something as it is practised, and play it back afterwards. The applications also give a variety of statistics for errors, some broken down by place. In order to interpret these statistics, however, some explanation is needed.
How accurate is accurate?
A typical row of ringing lasts about two seconds. Therefore, the typical gap is ⅓ second or 300 milliseconds.
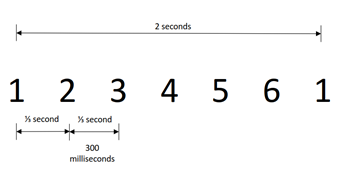
There are limitations on the human ear.
Two sounds made less than 20 milliseconds apart will seem to sound at
the same time. Therefore, in practice,
even the best ringers will struggle to get their bell within 10% of the
inter-bell gap (30 milliseconds). Therefore, an average error of 20% is
not bad, especially for newer ringers.
One of the problems with errors is that some blows will be early and some late. The +ve and -ve errors tend to cancel each other out. Therefore, in the Abel example (right) an error of 19% at handstroke is a measure of the distribution, ignoring whether the errors are late or early. The second figure, 13% early, indicates that the bell has a tendency to be slightly early.
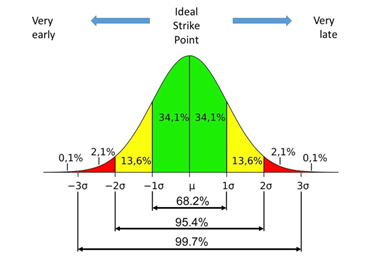
Some applications use standard deviation rather than average error to measure the distribution of the errors. This is a statistical measure, based on the assumption that the errors will follow a ‘normal’ distribution curve.
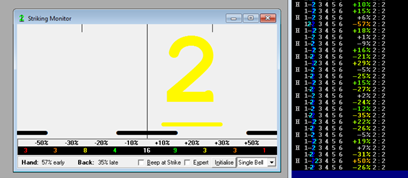
Abel - striking window
Virtual Belfry - striking window

Beltower - striking window
« Back to simulator software